
The climate investment ecosystem has been buffeted in recent months by the collapse of Silicon Valley Bank and the decline in climate tech financing from venture capital funds.
But it has been bolstered by a network of co-investors that has helped climate investment remain remarkably resilient compared to other tech sectors. Unlike banks where inter-dependencies increase systemic risk, co-investment relationships among venture investors are designed to mitigate risk.
The Climate Co-Investor Tracker, co-developed by Vibrant Data Labs and SecondMuse and launching today on ImpactAlpha, shows patterns of co-investment among backers of U.S. companies that describe themselves as working on climate mitigation and adaptation. Investors were included if they invested in two or more companies, and linked if they invested together in at least one company.
We analyzed the network of co-investment among ~1,300 climate investors and found that it is remarkably interconnected across a diverse range of sectors – spanning energy, agriculture, and nature-based solutions. We also investigated the role of grants and loans in the survivorship of companies from seed to late stage funding.
One clear takeaway: This investment ecosystem benefits from significant public subsidies. The most central co-investor of U.S.-based climate-relevant companies is the U.S. government. At least 96% of climate tech VC’s are just two degrees of separation from at least one government grant. We also provide some of the first empirical support for the hypothesis that early grants (and loans) increase the survival of startups past early venture and catalyze more follow-on funding.
And across almost all energy themes, there is a glaring ‘scale / social equity gap,’ and the most central climate lenders and grantors are not strategically filling that gap. We found that grants and loans are distributed across critical challenges areas of the energy sector as if they were assigned at random. This means that de facto, more new grants and loans are going to themes that already have more investments.
Ecosystem risk
Venture capital investments in climate tech have soared in the past five years.
“First there was the Industrial Revolution, then the Digital Revolution, and now we are in the Climate Revolution,” as former Techstars COO and 9Zero Ventures founder Scott Ford puts it.
Last month’s collapse of Silicon Valley Bank threatened to set back the progress. Not only was it the largest deposit holder of startups, but it also played a critical role as a lender.
“SVB filled a gap with working capital loans and venture debt hard to come by elsewhere,” according to Dawn Lippert, CEO of Elemental Excelerator, a leading nonprofit investor in climate tech solutions.
Here is the good news. Climate tech investors are connected to each other through co-investing relationships that are designed to reduce risk within individual investments. For example, risk-tolerant early investors mitigate risk for late-stage investors; the latter provide growth capital that increases the chances of success of the former. Sharing funding rounds with others allows each investor to diversify across more investees.
And unlike other tech sectors, the climate ecosystem stands to benefit from the largest federal subsidy program in generations.
Here is the difficult news. Solving the climate crisis is a complex systemic challenge with inherently high ‘ecosystem risk.’ In other words, the success of one investment often critically depends on the success of others. But more importantly, the failure of one alone can cause the cascading failure of many. As a trivial example, a successful investment in electric vehicles depends on successful investments in charging infrastructure, batteries, and power grid upgrades. If any one of these ‘critical challenges’ fails, investments in the others fail too.
Grants and loans de-risk individual investments but to reduce ecosystem risk, investors must strategically target underfunded “critical challenges”. We define a “critical challenge” as any solution theme that, if it fails, it alone can cause failure of the sector.
Using the co-investor map, We tracked patterns along the co-investment ‘food chain’ from pre-seed to post-venture to quantify the role of grants and loans. In this climate investment ecosystem, grants to early stage companies appear to significantly increase their survival to late venture and their ability to raise follow-on money.
This ‘grant bump’ disappears from late- to post-venture. Loans appear to play a significant role filling this gap in late- to post-venture success, both increasing survival and total money raised. Silicon Valley Bank was the most structurally central lender in this ecosystem; this strategic weak link in the investment life cycle must be filled by other lenders.
These broad patterns of diverse co-investment both across sectors and across the life cycle of a startup suggest climate tech is well positioned to swim against the economic tide facing other tech categories.
The climate revolution is unique from prior technological revolutions because we must intentionally build an entirely new economy from the bottom up. This is an “all-hands-on-deck” problem with inherently high ecosystem risk because a large set of critical challenges must all be overcome for any one solution to succeed.
All the hands need to see what the others are doing so that they can actively swim against the tide to fill critical gaps that mitigate ecosystem-level risk. The Climate Co-Investment Tracker is designed to facilitate more collaboration and complementarity by allowing everyone to see who is investing in what and co-investing with whom.
Co-investment networks
Using data generously provided by Crunchbase for the public U.S. Climate Finance Tracker, this analysis focuses on all funders – both venture and others – who are listed in Crunchbase as investors in at least two U.S.-based climate-relevant companies that raised capital in the five-year window from the first quarter of 2017 through the first quarter of 2022. Each funder was linked if they co-invested in at least one company.
Thus, our search for ‘climate-relevant’ investors was defined not by what the funders say they do, but by how their investees describe their work. These investees spanned diverse sectors from climate mitigation to climate adaptation and resilience, and from energy and mobility to agriculture and food to biodiversity and nature conservation.
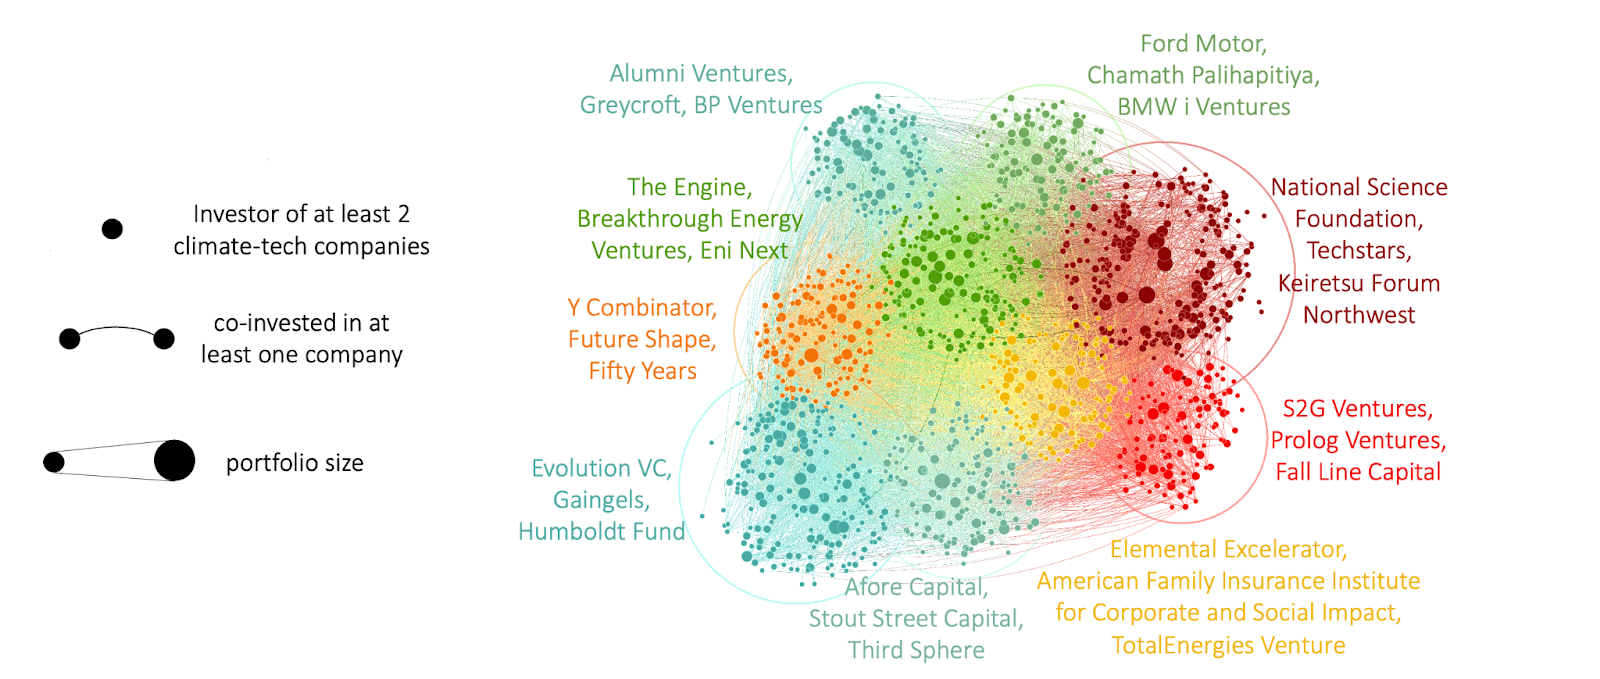
We expected climate investors to be tightly grouped into isolated ‘investor cliques’ that regularly co-invest with each other in a sector, but not with others from another. Instead, we found that the climate co-investing network is strikingly inter-connected. Of 1,343 funders that invested in at least two climate-tech companies in our dataset, 97% comprise one connected network, rather than multiple disconnected ones (see Figure 1). This suggests that climate investors are diversifying their portfolios across traditional sector lines.
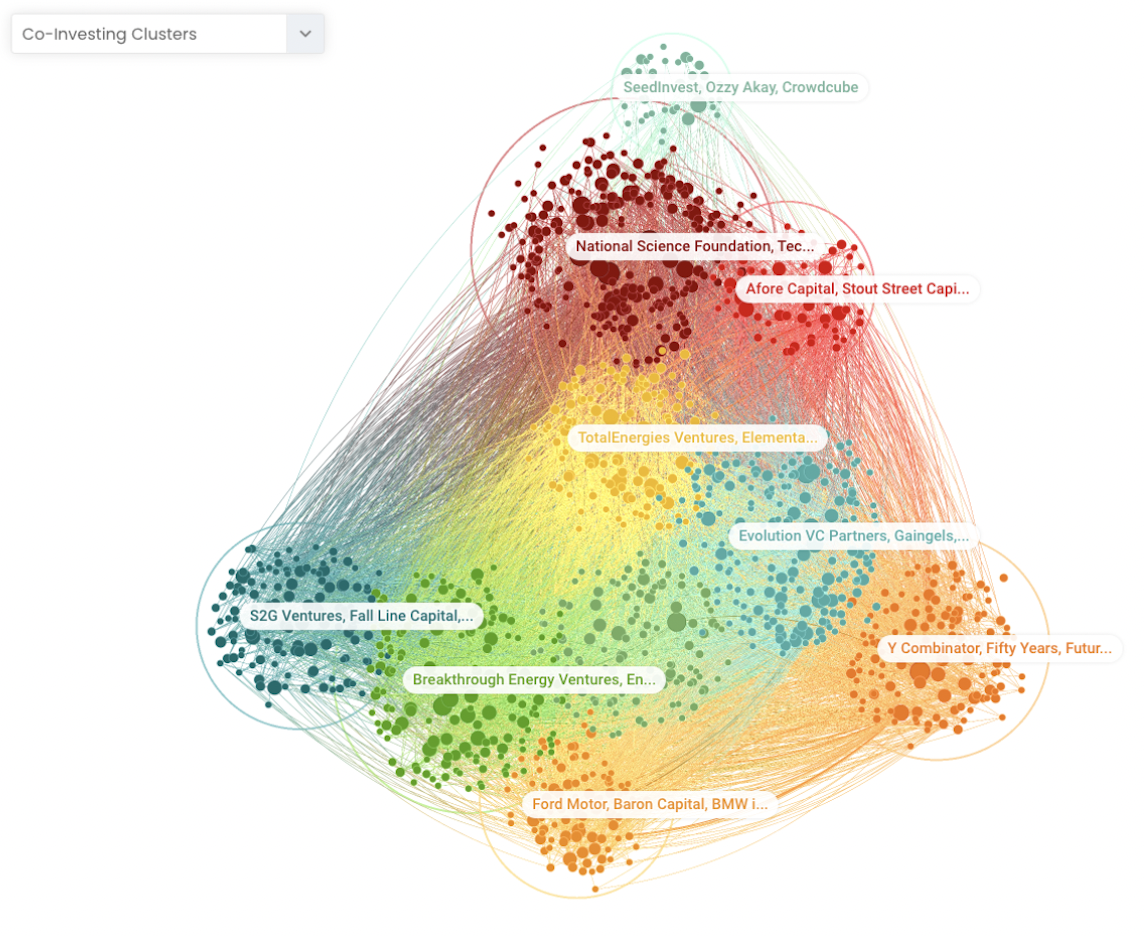
While everyone is connected, they are not equally connected. The data reveal nine ‘co-investing clusters,’ sets of investors who tend to co-invest with one another more with those in other clusters. The most common keywords of the portfolio companies in each cluster illustrate the diversity of climate themes represented.
These co-investing clusters are ‘loose’ – investors within each have on average 46% of their co-investing ties to investors in other clusters. Still, they may offer a guide to convening these unintentional collaborative groups to be more intentionally strategic in how they collectively co-invest to mitigate risk. Table 1 highlights the most structurally central investors of each co-investing cluster; the full list explorable in this interactive version of the map.
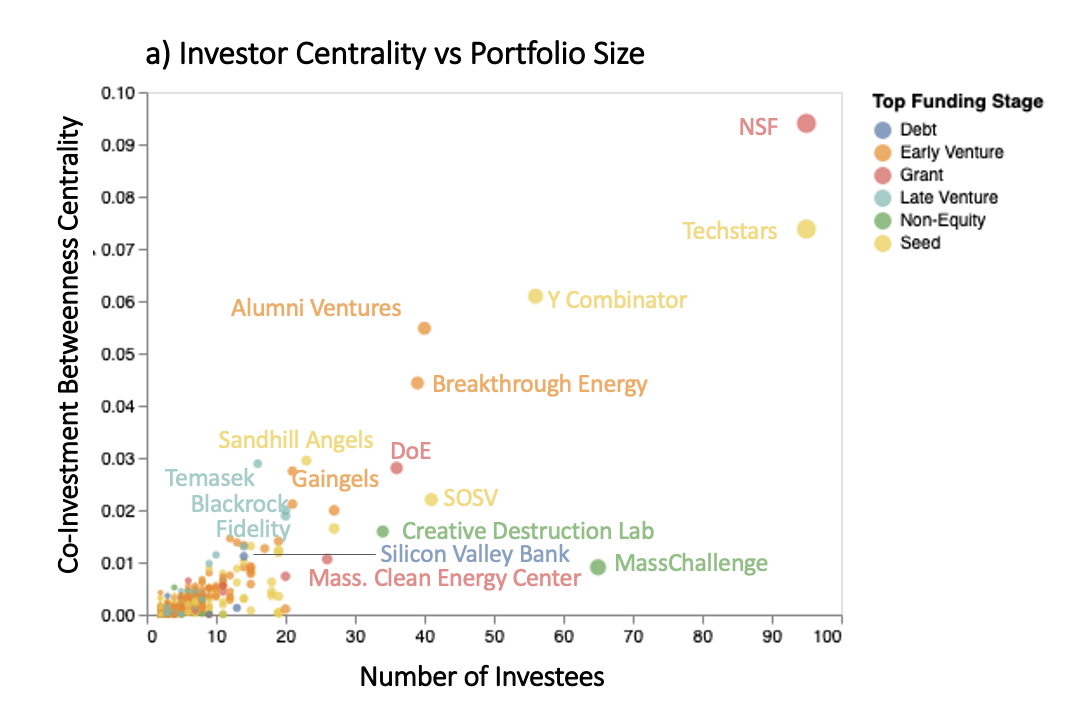
The connections in this co-investing network are highly non-random. A small set of investors play a disproportionately large role in connecting the entire network (see figure 2a). The most centrally connected investors in this network include some expected seed and early-stage investors like Techstars, Y-Combinator, Alumni Ventures, and Breakthrough Energy. The most central late-stage investors are Temasek, Blackrock, and Fidelity. Silicon Valley Bank is (or was) the most structurally central loan provider with Rabobank and Advantage Capital a distant second and third.
Perhaps more surprising, two of the top 10 most central funders of climate-relevant companies are the National Science Foundation and the Department of Energy. In fact, the single most structurally central climate tech ‘investor’ is NSF, which is de-risking climate tech investments with early innovation grants. What makes NSF so central is not just the number of investments, but the wide diversity of those investments that tie together co-investors from different sectors.
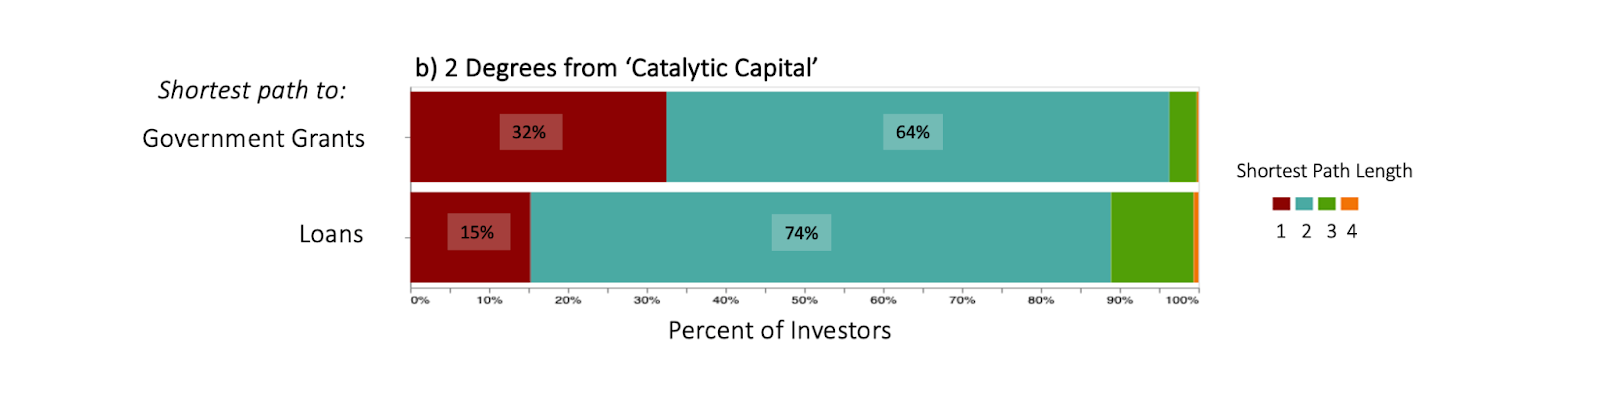
Indeed, almost one third of climate tech investors directly co-invest with at least one government agency (one degree of separation), and over 96% have at least one co-investor that directly benefits from government grants (Figure 2b). Put another way, 96% of climate tech VCs are “two degrees from government grants,” even though government agencies comprise just 1% of the climate tech funders. Likewise, at least 89% of climate tech VCs are within two degrees from loans (Figure 2b).
Catalytic capital
The pervasiveness of government funding and other non-equity funding is encouraging as these – and other forms of catalytic capital, defined as “investment capital that is patient, risk-tolerant, concessionary, and flexible” – can be essential to de-risk high impact investments.
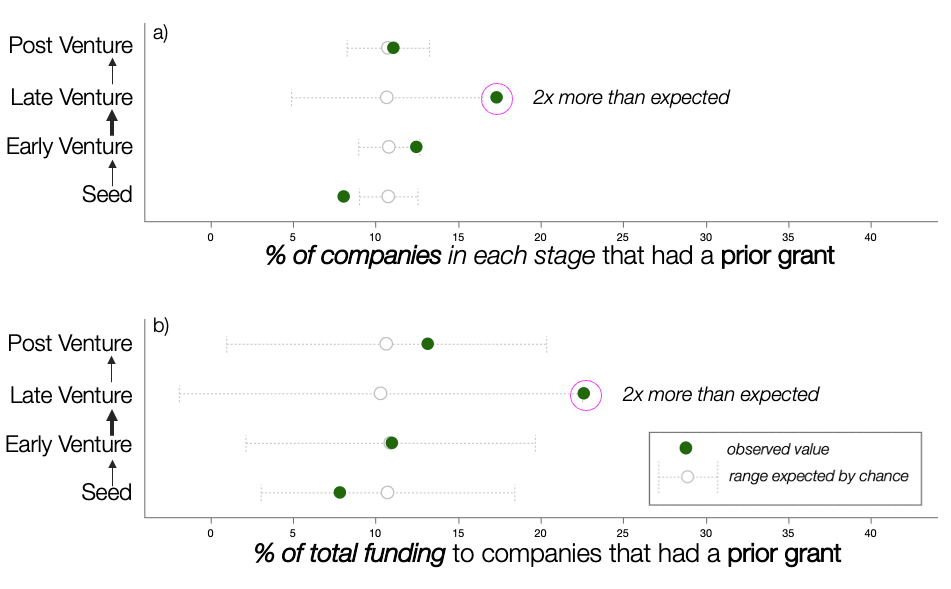
We evaluated whether grants or loans increase the ‘survivorship’ of climate-relevant companies to later stages and their ability to raise more follow-on money. To do this, we compiled the complete funding round sequence that was available in Crunchbase for each company in our dataset. We then calculated for each broad funding stage (i.e. seed, early-venture, late-venture and post-venture) the fraction of companies that had a grant or loan in a prior funding stage, and the fraction of total funding in each stage that went to those companies (see figures 3 and 4).
If prior grants or loans are ‘catalytic,’ we would expect the fraction of companies in a given stage with prior grants or loans (and the total funding to those companies) to be significantly greater than expected by chance. To evaluate that hypothesis, we randomly reassigned who got a grant and/or loan in the entire database and repeated the exercise 1,000 times to get the distribution values we would expect by chance, and compared that to what was observed.
The results suggest that grants play a significant role in increasing survivorship of companies to late-venture, and the fraction of total funding raised by companies of that stage (see figure 3).
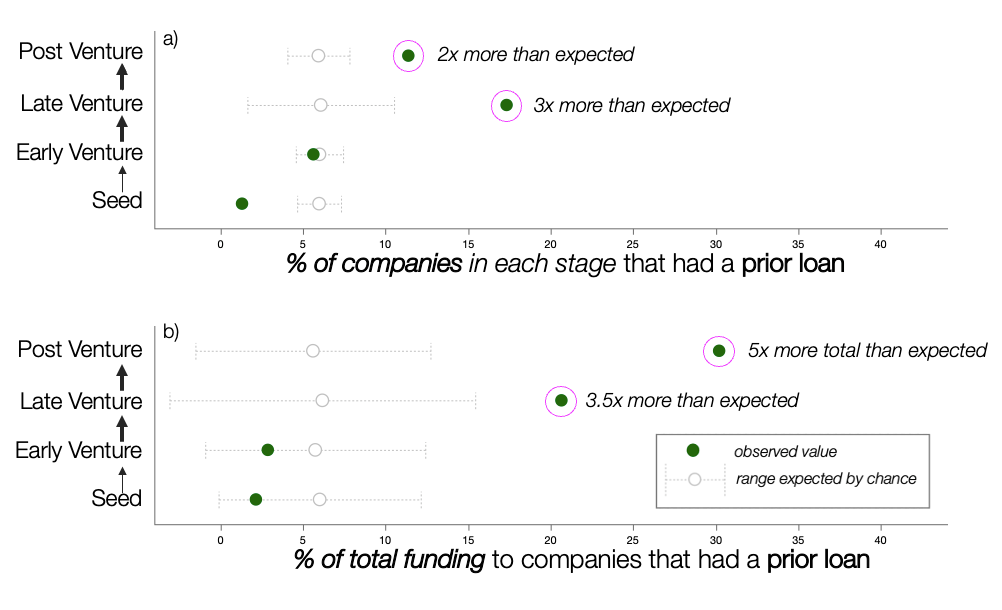
However, this ‘grant bump’ disappears from late- to post-venture. Meanwhile, loans appear to fill that gap by increasing survivorship to late- and post-Venture stages (see figure 4a). In particular, post-venture companies that had an earlier stage loan captured 5x more total funding of that stage than expected by chance (see figure 4b).
De-risking
To maximize the positive impact of grants and loans in fueling the Climate Revolution, they must be intentionally targeted to reduce ecosystem-level risk from interdependencies among solutions.
The Italian-American-British economist Mariana Mazzucato has made a compelling case that government grants were critical fuel for the entrepreneurial engine behind the digital revolution. “Every technology that makes the iPhone so ‘smart’ was government funded: the Internet, GPS, its touch-screen display and the voice-activated Siri,” she writes.
However, none of these technologies were intentionally built for that purpose. The government funded many cutting-edge ideas, and decades later a few, by chance, proved critical for the digital revolution. It was more of an evolutionary process than an intentional revolution.
The Climate Revolution is different. We know what we want to achieve, and we don’t have time to waste. Numerous efforts, including Project Drawdown, OneEarth, Systems Change Lab, ReGeneration, Speed and Scale, have rigorously defined the solutions needed to meet the Paris Climate Accord targets by 2050.
The meta-problem is that all these solutions have dependencies, and a subset of those dependencies are critical challenges, defined here as challenges that all must be solved for anything to work (i.e., if one fails, they all fail).
Thus, in every sector and sub-theme of climate investing, for catalytic capital to mitigate ecosystem risk, it should be strategically allocated toward under-funded critical factors that have been overlooked by venture. To do so requires two things: 1) identifying core sets of critical factors for a given climate solution, and 2) tracking the flows of capital to each to identify the gaps. Here are two examples.
Energy grants and loans. A core pillar to achieve the targets of The Paris Climate Agreement is to transition society to 100% renewable energy and mobility. To achieve this requires simultaneously addressing at least the following critical factors: energy generation, storage, transmission, and distribution, and energy efficiency, as well as clean energy transit, vehicles, and charging infrastructure.
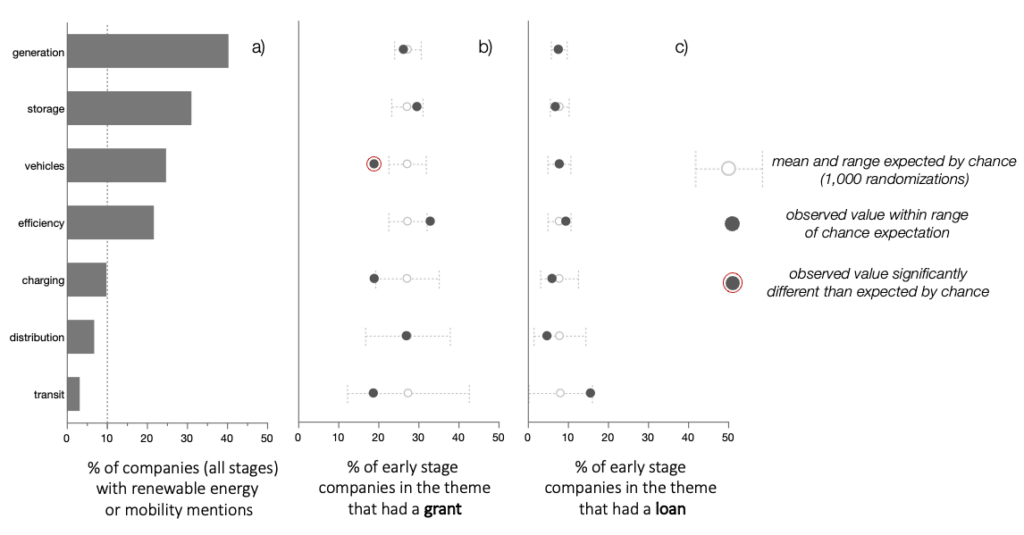
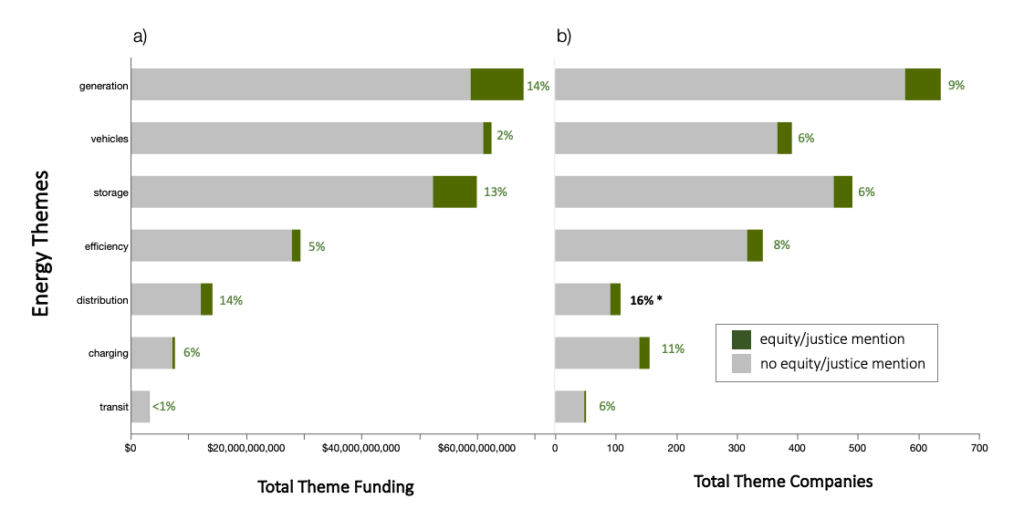
To estimate rough differences in the fraction of total investments going to each energy theme, we scanned investee self-descriptions for mentions of terms indicative of each (Figure 5 a). Energy generation (e.g. solar, wind, hydrogen, etc.), electric vehicles (of all types), and battery technology companies receive the lion’s share of investments – while there is a comparative investment gap in technology related to energy transmission, distribution, as well as charging and public transit.
To evaluate if recent grants or loans to new companies are being strategically allocated to fill those gaps, we calculated for each theme, the fraction of early stage companies (pre-seed, seed, or early venture that received a grant or a loan. We then randomly re-shuffled the assignment of who got a grant or loan and repeated the exercise 1,000 times, to see where the observed recent allocation of grants or loans to early stage companies was surprising relative to expected by chance.
In this dataset, early stage grants and loans appear to have been allocated across themes as if they were distributed at random (Figure 5 b and c). Only in one case – electric vehicles – is the allocation of grants “swimming against the tide” with significantly fewer companies receiving an early grant than expected by chance. In all other cases, the fraction of early stage companies that recently received a grant or loan was within the range of 1,000 randomized assignments of grant or loans.
Together these results suggest that, while both grants and loans have the potential to increase start-up survival (Figure 3) and total funding (Figure 4), neither grants nor loans are being strategically, or non-randomly, allocated to fill under-funded gaps in critical energy themes. This means that de facto, more grants and loans are going to themes that already have more investments.
Scaling. A universal critical factor that applies to all the energy themes above is the need for adoption at scale. 100% transition to renewable electric mobility requires, by definition, that 100% (not just the 1%) have access. So, in climate tech, addressing social equity is critical for accelerating the scale of adoption.
This scale-dependency transfers across solutions. For example, if low-income rural communities don’t have easy access to affordable electric vehicles (or energy independence for free home charging), there is no market for scaling charging infrastructure to rural areas.
To explore the ‘scale/social equity gap’ in climate investments across energy themes, we looked for explicit mentions of over 150 social equity and justice terms (e.g., ‘low-income’, ‘affordable’, ‘accessibility’, ‘energy poverty’, ‘rural communities’ – see the US Climate Finance Tracker for a complete list) in the investee self-descriptions on Crunchbase, LinkedIn, and their company website. (While a mention of social equity or justice does not mean they are actually doing it, it at least shows an explicit intention. Thus, tracking mentions is likely a conservative estimate of the climate equity investment gap because the error is likely biased towards companies more commonly mentioning social equity and not doing it well, than doing it well and not mentioning it.)
Of the approximately $150 billion in energy-relevant investments to U.S.-based companies we tracked, there is a pervasive gap across all themes in investees that articulate an explicit intent to address social equity based on the language of their self-descriptions (Figure 6). Across the entire sector, only 8% of funding went to companies that mention anything relevant to social equity terms (Figure 6). While there was some variation across energy themes in the fraction of investments to companies that mention social equity terms, this variation was generally within the range expected by chance. One interesting exception was the ‘energy distribution’ theme, which contained a significantly higher fraction of companies that mention equity/justice terms than expected. These included companies that focus on micro-grids for energy independence in rural communities.
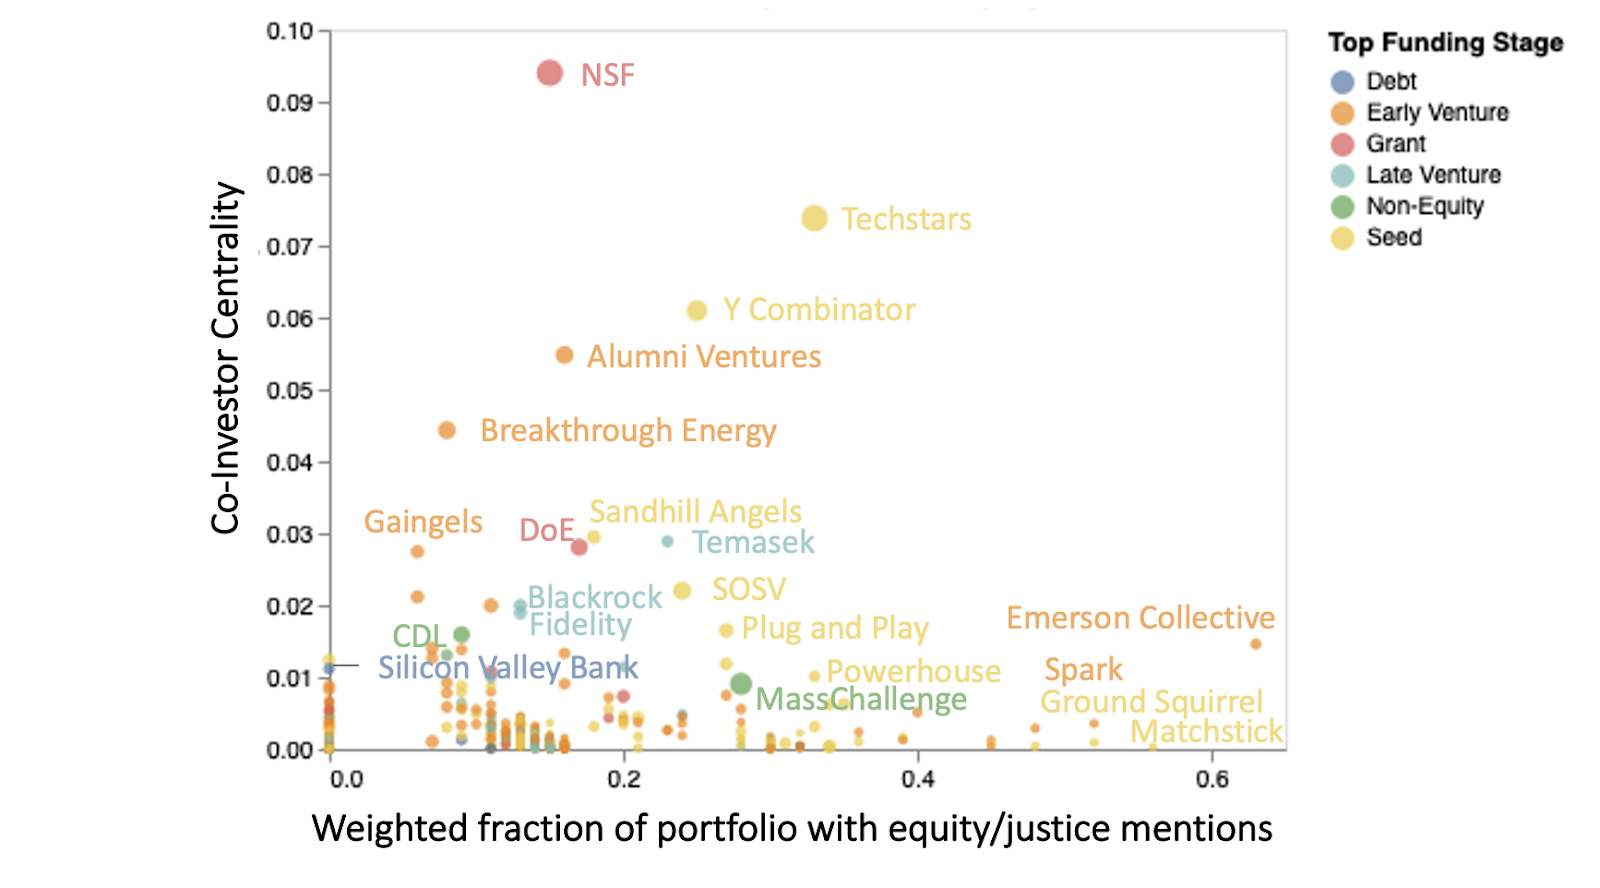
To explore in our co-investor network who is potentially reducing ecosystem risk by addressing the scaling/social equity gap, we tallied, for each investor, the fraction of their portfolio companies that explicitly mention at least one social equity/justice term (defined above), weighted by the log of the portfolio size. When plotted against investor centrality (Figure 7), we can see a small isolated set of niche seed and early-stage investors (notably, Emerson Collective, Spark, Ground Squirrel, Matchstick, and others) that are de-risking businesses which self-articulate explicit intent to serve the underserved.
Highly central government funders – National Science Foundation and the Department of Energy – are not, but Techstars is moving in that direction. The largest and most social equity-focused provider of non-equity assistance is MassChallenge, but it is not a structurally central co-investor.
And the most central lender to climate tech companies, Silicon Valley Bank, had no explicit focus on reducing ecosystem risk by supporting companies that are addressing the climate equity scaling gap.
Note: This post was revised July 7, 2023.
Eric Berlow, a ‘data ecologist,’ is founder and CEO of Vibrant Data Labs, a social impact data science company building open-source tools to empower a growing ecosystem of partners that are tackling the climate crisis.
Ryan Jones is a senior associate for climate tech at SecondMuse.