
In researching companies for inclusion in the HIP Climate Solutions Portfolio, I’ve been analyzing pollution and greenhouse gases, or GHGs, diving deep into “Scope 3” emissions. The deeper I have dived, the more I have learned that the numbers don’t always tell the full story.
For context, greenhouse gases can be accounted for in three main streams. “Scope 1” emissions are produced directly from a company’s own operations, including factories, trucking, retail shops, and logistics centers. “Scope 2” emissions come from the energy a company purchases from utilities and independent power producers. And “Scope 3” emissions accrue across the full value chain of a product. They include upstream emissions from suppliers and downstream emissions created by a product’s users throughout its lifecycle and ultimate disposal.
The carbon particles that come out of the exhaust pipe of a car year after year would be considered Scope 3 emissions for that car’s manufacturer, for example. Emissions from a supplier’s farm vehicles would be considered Scope 3 emissions for a packaged food company.
Scope 3 emissions can make up a huge percentage of a company’s carbon footprint. They are also notoriously difficult to calculate, with varying methodologies in use. When assessing a company’s true climate impact, it is critical to understand the way it is measuring its emissions.
Below, we will analyze the example of the Swiss electrification and automation giant Asea Brown Boveri, or ABB, a HIP portfolio company.
At first glance, it looks like a climate laggard, with significant Scope 3 emissions. But as we dig into how those numbers are calculated, a different story emerges: ABB is tackling some of the dirtiest parts of the economy, helping others cut their emissions at scale. And, since 96% of its emissions are Scope 3, measuring them rigorously makes it possible for the company to reduce them meaningfully over time.
Why climate leaders can look like heavy emitters
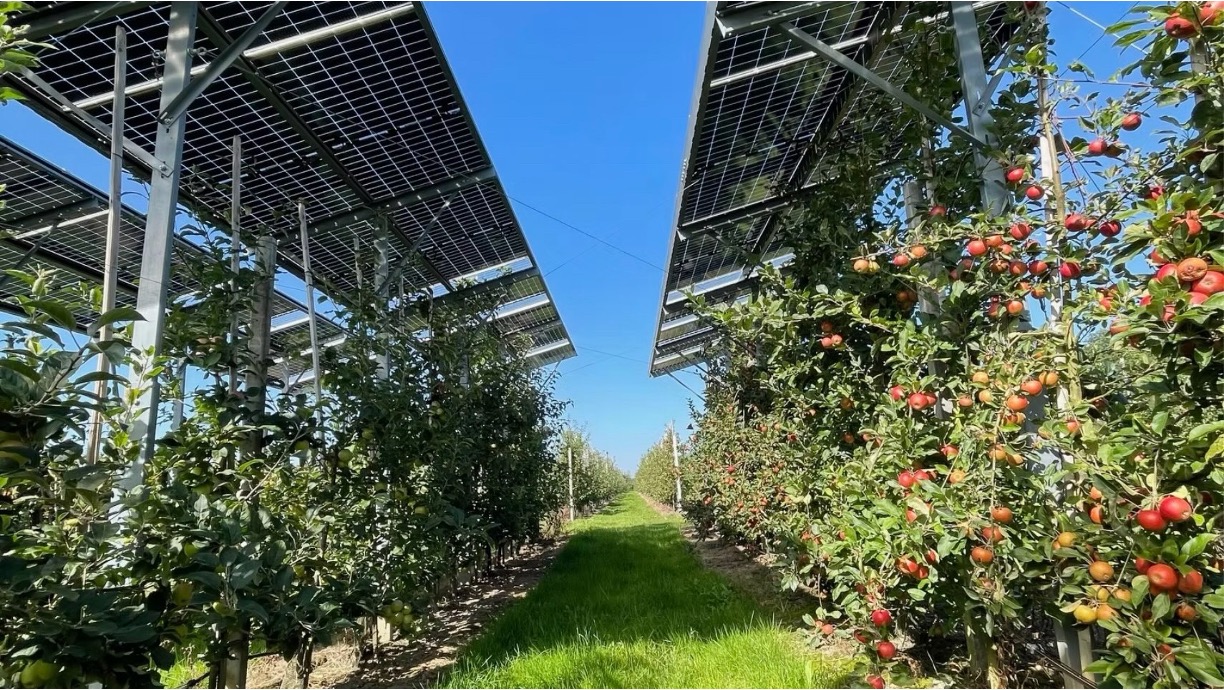
HIP’s Climate Solutions investment strategy focuses on companies whose products and services drive measurable climate action and enable a transition to a lower-carbon and more sustainable economy. Trane Technologies, for example, produces heat pumps that deliver more efficient air conditioning and heating. ABB manufactures electrical sensors and transformers that help reduce energy waste. Iberdrola is a global leader in solar power. Together, these companies exemplify the kinds of solutions enabling the transition to a lower-carbon, more sustainable economy.
Considering that focus, an investor might be surprised to find that our Climate Solutions portfolio (labeled HIP CLIM below) has much higher average Scope 3 emissions than its overall diversified benchmark (MSCI’s ACWI index of large and mid-capitalization developed and emerging market equities).

Source: Science Based Targets Initiative, CDP; HIP Investor analysis
Although the HIP Climate Solutions equity strategy invests in companies with products and services that can reduce pollution to avoid greenhouse-gas emissions, many of these businesses serve energy-intensive customers — like utilities that need cleaner energy and manufacturers that need ever-more-efficient motors.
This dynamic can make climate solutions companies that serve high-emissions industries look disproportionately dirty on paper, thanks to their indirect Scope 3 emissions. For example, when Trane sells a heat pump to help a facility electrify their HVAC, they then take on the carbon footprint of the energy mix used to power the system.
Scope 3 emissions measurement can feel like the Wild West
The more I study this topic, the more I see variability, but discipline, across methodologies.
In the industrials sector, Scope 3 emissions calculation methodologies can vary widely due to the diversity and complexity of multi-tiered supply chains and downstream impacts.
For upstream purchased goods like raw materials and manufacturing components, some companies rely on spend-based approaches that apply average emission factors to purchased goods and services using procurement data and then reverse engineer an implied GHG. Other firms pursue supplier-specific life cycle assessments that capture process-level emissions for materials like steel, cement or chemicals. This use of supplier specific data encourages companies to use carbon intensity as a criterion in vendor management.
To calculate emissions from transportation and distribution of a product, methodologies may differ between using actual fuel consumption data from logistics providers versus applying generic emission factors based on distance and transport mode.
Companies can estimate downstream, product use-phase emissions — especially for energy-intensive equipment or machinery — through modeled lifetime energy consumption, customer-reported usage patterns or industry benchmarks.
Finally, methodological differences often hinge on boundary-setting and data quality: whether a company includes only direct “tier” suppliers, or extends further upstream, and whether it invests in gathering primary supplier data or relies on secondary databases or industry averages. These choices directly affect both accuracy and comparability, underscoring the need for transparency and sector-specific guidance — especially in Industrials, where product lifecycles are long and energy demands are high.
Emissions evolution at Asea Brown Boveri: A case study
Swiss-headquartered Asea Brown Boveri, or ABB, has spent decades advancing automation and electrification solutions that help heavy-emitting industries lower fuel use and enhance efficiency. It serves a number of heavy pollution and GHG emitters in sectors such as utilities, industrials, manufacturing, transportation, building, and infrastructure.
Given ABB’s substantial year-to-year fluctuations in reported Scope 3 emissions, the company offers a compelling case study in how industrial electrification can both create and measure decarbonization impact.
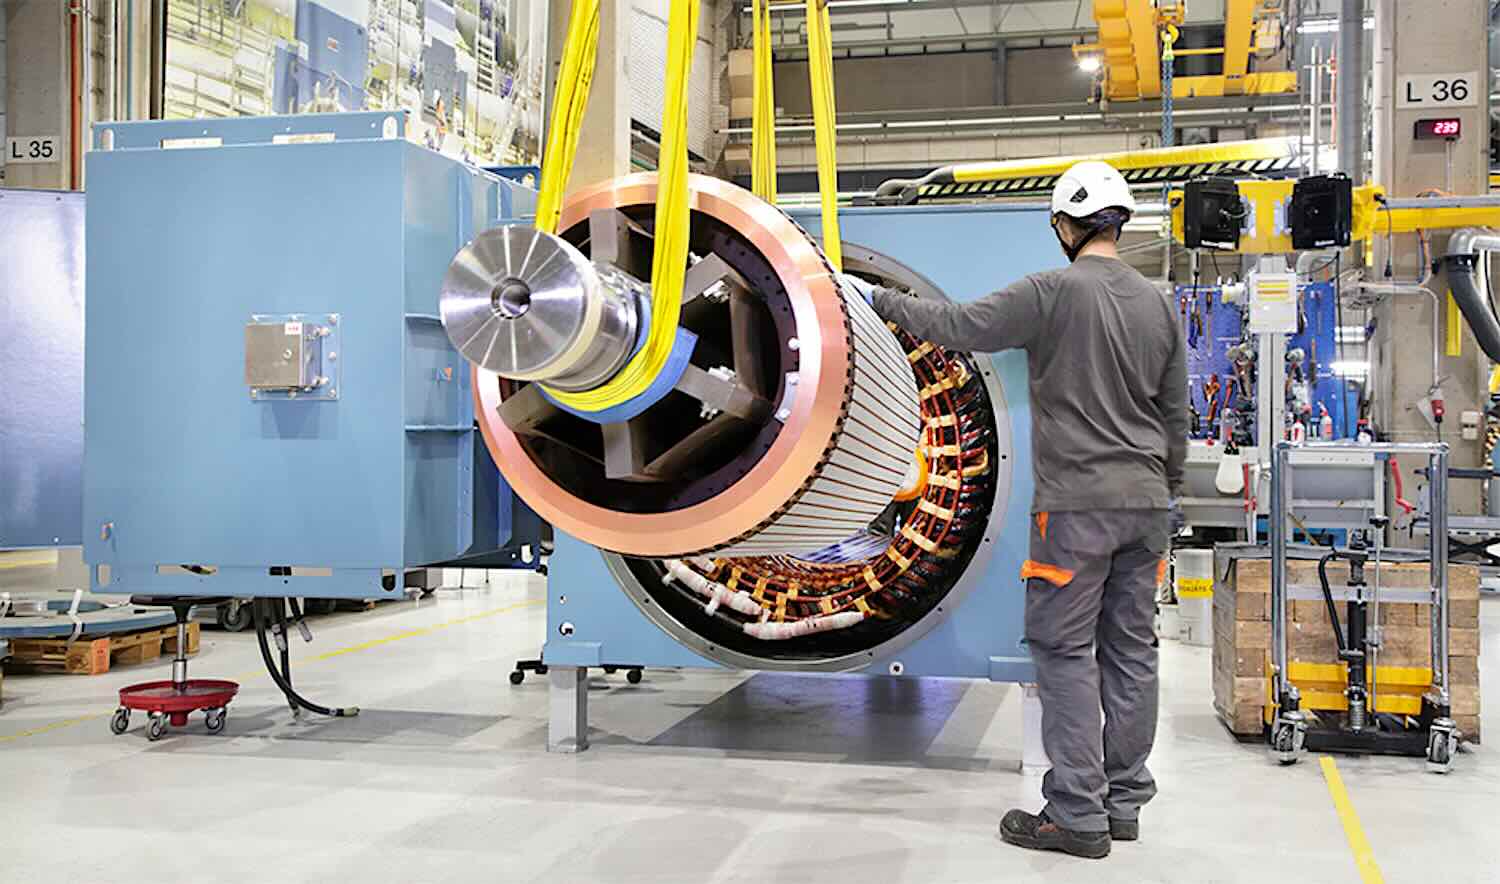
ABB’s product portfolio includes energy-efficient motors and drives that are widely applied across industries, buildings, and infrastructure, as well as electric vehicle charging systems. Customers can reduce their emissions by up to 80% with variable speed drives for motors, or up to 30% through specific products like robotics services and energy management solutions. ABB’s offerings also enable the integration of renewable energy into the grid.
By tackling the most energy-intensive industries, ABB stands to create a positive impact in avoided emissions, but also to rack up large downstream Scope 3 emissions. The latest report shows that 96% of ABB’s emissions are derived from customer usage of their products.
Over the past few years, ABB has overhauled its Scope 3 accounting. The change led to a significant increase in reported Scope 3 emissions. Yet the jump does not reflect dirtier operations, just better data and tougher standards.
ABB’s 2022 sustainability report includes Scope 3 GHG emissions, calculated using a combination of average emission factors and internal data such as product performance, sales volumes and average lifetimes, covering 13 of the 15 relevant Scope 3 categories.
For the “Use of sold products” category, emissions were calculated from energy losses in equipment such as motors, drives, switches, switchgear, and breakers during conduction, conversion, and transformation of electricity. For products with direct energy consumption, such as industrial robots, emissions are based on electricity use across their expected service life.
In its 2023 sustainability report, ABB’s Scope 3 emissions were calculated using a new bottom-up model where each business area compiled Scope 3 inventories. This report introduced a “two scenario” approach to estimate customer emissions, including both a “representative scenario” (based on energy loss) and a “strict scenario” (energy input-based) approaches for calculating emissions.
This strict scenario is what ABB submitted to the Science-Based Targets Initiative, which compiles specific GHG reduction targets of 1,150 public equities globally. It used real-life data sets, incorporated International Energy Agency grid electricity emission factors, and should be considered more auditable.
It also produced a 3.5x increase in reported Scope 3 emissions.
The 2024 Sustainability Report brought standardization into the single strict scenario (energy input method). It increased the use of primary data while acknowledging continued reliance on estimations. ABB targets were officially validated by the Science Based Targets initiative in June 2024.
ABB explains these changes were driven by:
- Regulatory Clarity: Need for consistent reporting as regulations evolve
- Stakeholder Demands: Pressure for more transparent, comparable metrics
- SBTi Requirements: Alignment with Science Based Targets initiative standards
- Data Quality: Availability of better primary data sources over time
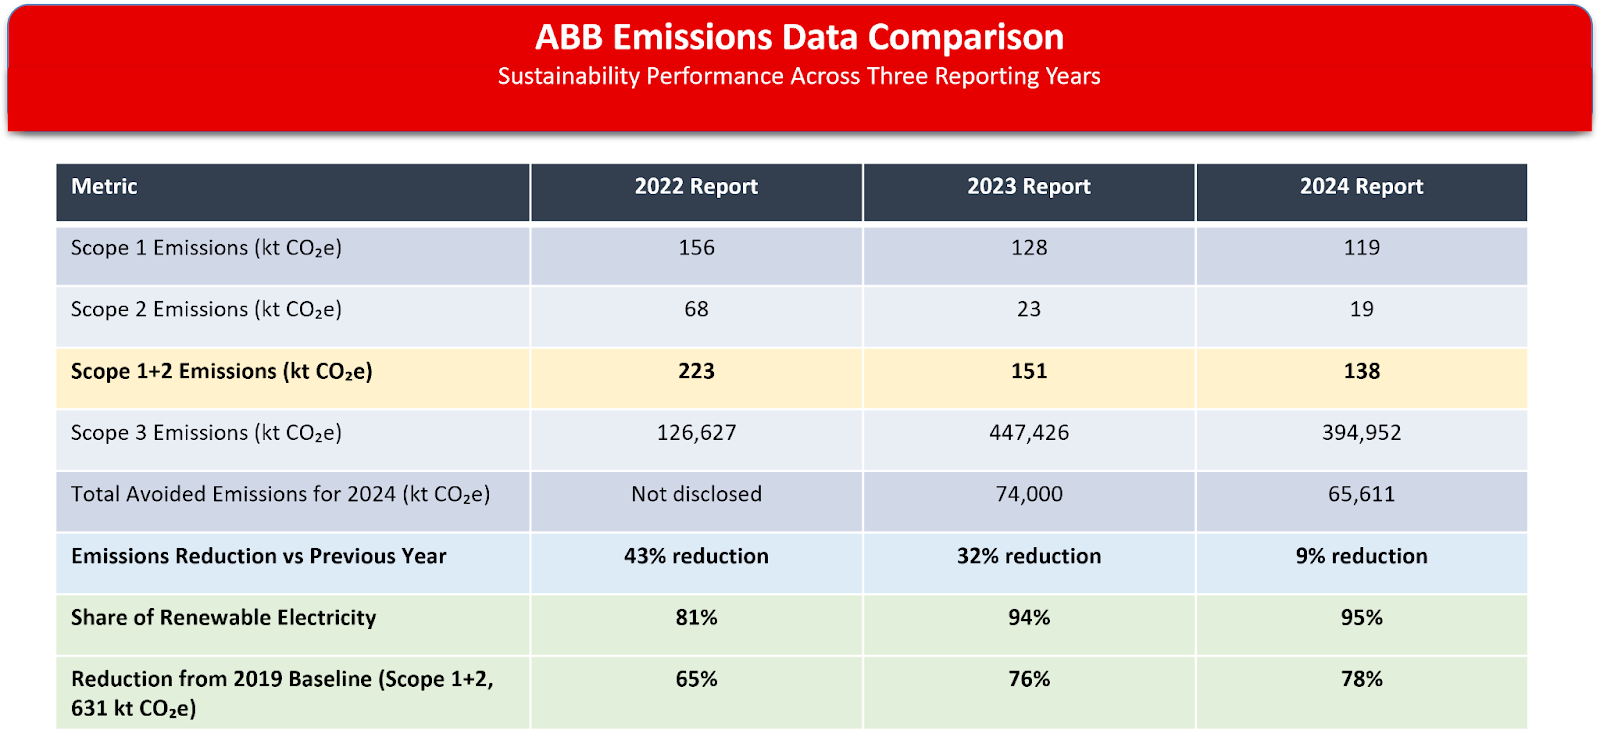
The data clearly show ABB’s ambitious but achievable targets, and demonstrates that the company is well ahead of schedule for its 2030 commitments. This positions ABB for a very good chance to achieve its ultimate 2050 net-zero goal: 100% reduction of combined Scope 1 and 2 emissions and 90% reduction of Scope 3 emissions.
These shifts in methodology show progress, but they also demonstrate the variability possible in emissions assessment. They drive home the importance of not only comparing numbers, but understanding what the numbers being compared represent. Just by looking at the above table, one might think that ABB had a huge jump in Scope 3 emissions between 2022 and 2023, but this report intends to illuminate the nuances and orders of magnitude differences of these varying calculations and estimations.
Jevon’s Paradox: More efficiency = more usage
The last topic to touch on is a cautionary one. As we scale up renewable energy and increase energy efficiency, there may be an urge to increase consumption.
Jevon’s paradox is the observation that as technological improvement increases resource efficiency, the rate of consumption of that resource increases due to lower costs. The rebound effect is that efficiency makes a product cheaper to operate, which encourages customers to use it more frequently or for new applications. This increased usage can offset, or even exceed, the savings from the efficiency improvement.
If ABB develops a more energy-efficient motor, the lower operating cost might incentivize customers to buy more motors or use them for more applications, such as running a factory line for longer or automating a process that was previously uneconomical.
It is good that ABB’s revenue is growing, but as a society, we require more just because they are produced efficiently. We need both more efficiency and reduced consumption to combat climate change.
———————————————————————————————————
Nick Gower is Senior VP at HIP (Human Impact + Profit) Investor.
Disclosure: I own ABB and have special interest in ABB as it is a top 10 holding in the Climate Solutions investment strategy that I co-manage at HIP Investor Inc.